Observability wide events 101
- [
- observability ]
Wide events are a very simple concept: for each request, emit a single context-rich event/log per service hop. That’s it. Don’t let all the buzzwords fool you.
Let’s say you’re building a blogging platform, and users can save articles. A simplified implementation of the POST /articles endpoint might look like this:
- User makes a request from a browser
- Request hits your
gatewaywhich authenticates and orchestrates various downstream services gatewaycalls thearticlesservice. This service adds the article in the database and caches the resultgatewaycalls thenotificationsservice which emails all relevant subscribers to the bloggatewaycalls theanalyticsservice which sends a message to a queue for product analytics

In a nutshell, each of these services, from the browser to the database and queue, should emit a single structured wide-event with an arbitrary number of fields. All these events must be connected with a request ID, such that you can correlate all of them together.
Why use wide events?
Zooming in on the articles service, its events should include details from your business logic such as the user, their subscription, the saved article, the response status code, etc.:
{ "method": "POST", "path": "/articles", "service": "articles", "outcome": "ok", "status_code": 201, "duration": 268, "requestId": "8bfdf7ecdd485694", "timestamp":"2024-09-08 06:14:05.680", "message": "Article created", "commit_hash": "690de31f245eb4f2160643e0dbb5304179a1cdd3", "user": { "id": "fdc4ddd4-8b30-4ee9-83aa-abd2e59e9603", "activated": true, "subscription": { "id": "1aeb233c-1572-4f54-bd10-837c7d34b2d3", "trial": true, "plan": "free", "expiration": "2024-09-16 14:16:37.980", "created": "2024-08-16 14:16:37.980", "updated": "2024-08-16 14:16:37.980" }, "created": "2024-08-16 14:16:37.980", "updated": "2024-08-16 14:16:37.980" }, "article": { "id": "f8d4d21c-f1fd-48b9-a4ce-285c263170cc", "title": "Test Blog Post", "ownerId": "fdc4ddd4-8b30-4ee9-83aa-abd2e59e9603", "published": false, "created": "2024-09-08 06:14:05.460", "updated": "2024-09-08 06:14:05.460" }, "db": { "query": "INSERT INTO articles (id, title, content, owner_id, published, created, updated) VALUES ($1, $2, $3, $4, $5, $6, $7);", "parameters": { "$1": "f8d4d21c-f1fd-48b9-a4ce-285c263170cc", "$2": "Test Blog Post", "$3": "******", "$4": "fdc4ddd4-8b30-4ee9-83aa-abd2e59e9603", "$5": false, "$6": "2024-09-08 06:14:05.460", "$7": "2024-09-08 06:14:05.460" } }, "cache": { "operation": "write", "key": "f8d4d21c-f1fd-48b9-a4ce-285c263170cc", "value": "{\"article\":{\"id\":\"f8d4d21c-f1fd-48b9-a4ce-285c263170cc\",\"title\":\"Test Blog Post\"..." }, "headers": { "accept-encoding": "gzip, br", "cf-connecting-ip": "*****", "connection": "Keep-Alive", "content-length": "1963", "content-type": "application/json", "host": "website.com", "url": "https://website.com/articles", "user-agent": "Mozilla/5.0 (X11; Linux x86_64) AppleWebKit/537.36", "Authorization": "********", "x-forwarded-proto": "https", "x-real-ip": "******" }}At a glance, you can see that an article was posted by a user on a free trial expiring on September 16th. The service responded with 201 status code in 268ms.
Wide events must have the following characteristics:
- high cardinality: each field can contain an unbounded number of unique values, such as user IDs, session IDs, or transaction IDs. You could have billions of these per day.
- high dimensionality: by definition, wide events should have a large number of fields (dimensions) to provide deep insights
- context-rich: all those fields should carry context about the request, from request headers to infrastructure details, and custom business logic data
The problem with logs and metrics
Wide events enable you to answer questions that are simply impossible to answer with traditional logs or metrics. Imagine, instead of wide events, we had opted for logs and metrics in the articles service:
2024-09-08 06:14:05.280 Received POST /articles request2024-09-08 06:14:05.298 Saving article: f8d4d21c-f1fd-48b9-a4ce-285c263170cc2024-09-08 06:14:05.449 Article saved: f8d4d21c-f1fd-48b9-a4ce-285c263170cc2024-09-08 06:14:05.451 Response time: 254ms2024-09-08 06:14:05.460 Successful request: 201And a set of metrics charts, for request duration, number of articles created and number of failures on the route.
Now imagine this user emails you, saying every time they create an article, it doesn’t appear on the website, along with a video showing the issue. And 67 more users give you the same feedback. How do you start debugging this. Your logs tell you everything is fine, the articles are in the database, and your metrics chart don’t show any unexpected behaviour.
This is what we call unknown unknowns. Logs and metrics help capture ‘known unknowns’ - issues you can anticipate while building your application. Things such as slow requests, errors, database failures, or obvious potential issues in your business logic; for example missing environment variables, or “impossible” code paths, etc.
But you are left hanging when it comes to unexpected behaviour you couldn’t predict before your code got into the hands of real users and they started doing unexpected things.

With wide events, and the appropriate tooling, you can investigate and solve these issues without pulling your hair out. I emphasize on appropriate tooling; wide events are only the first piece, and without appropriate tooling you’re only halfway there.
Tooling
Whichever tool you use, it should have the following characteristics:
- queryable across any dimension: you should be able to query across any of the fields in your events
- no pre-aggregation: your events should be stored as they are emitted, without pre-aggregation. you should have access to the raw data, not just a value that was extracted from a batch of events
- fast: querying your events should be fast, ideally sub-second; but definitely sub-minute.
- affordable: observability should not bankrupt your application, sampling can drastically help here.
I used to be a vendor and hitting all those points is extremely hard, but you should demand no less from your vendor or your custom-built solution.
How to use wide-events
For the eagle-eyed, the wide event we illustrated above actually has the answer to our previous bug (newly posted articles don’t show on the website for a subset of users).
But let’s plot investigate with some graphs based on our wide events. Let’s start with number of articles posted. I’ll use the SQL syntax to illustrate the queries I’m writing to generate the graphs but your solution probably has a custom query language.
Number of articles posted
select count()from eventswhere method = "POST"and path = "/articles"and status_code = 201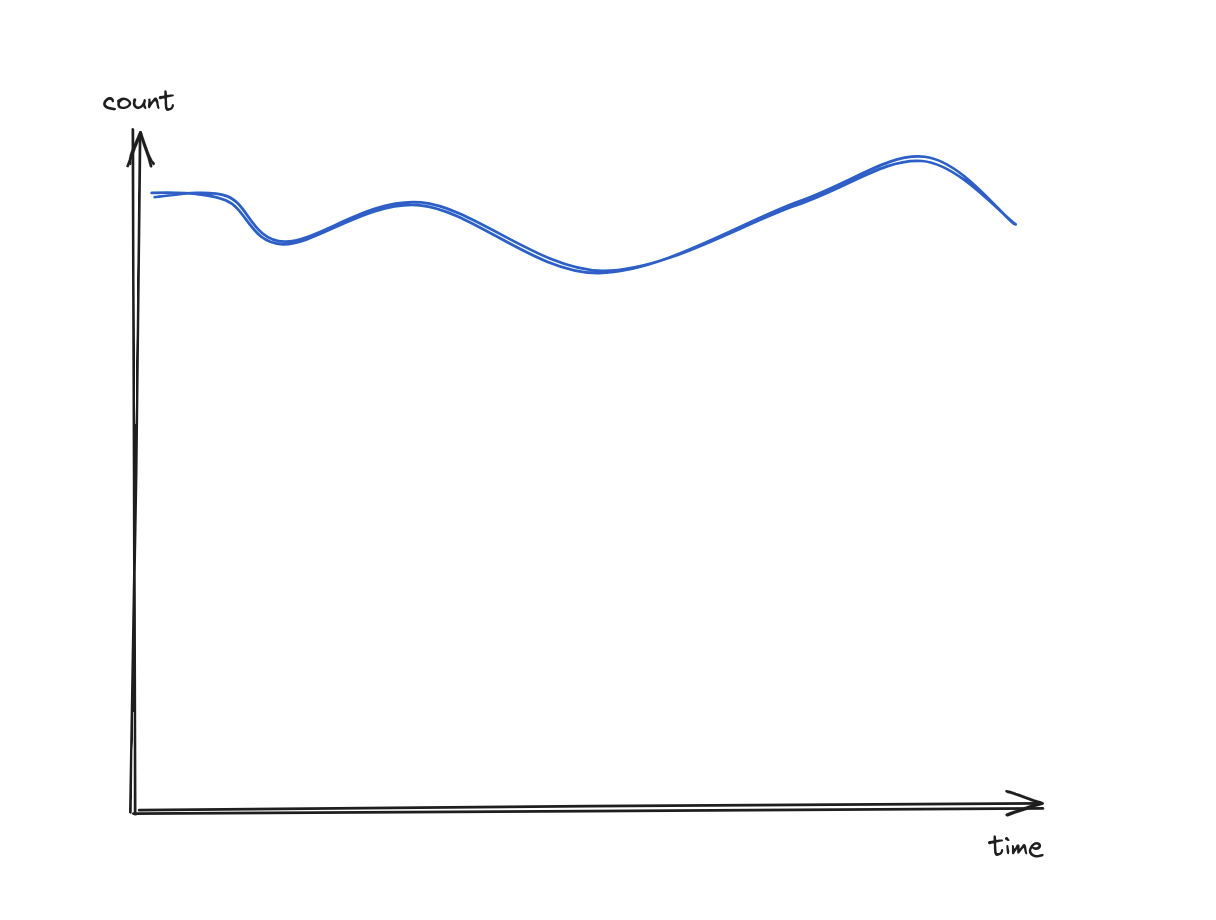
Nothing to note on this chart, the number of articles successfully posted has been constant. But are they published? Let’s group by article.published.
Number of articles posted grouped by article.published
select count()from eventswhere method = "POST"and path = "/articles"and status_code = 201group by article.publishedorder by count() desc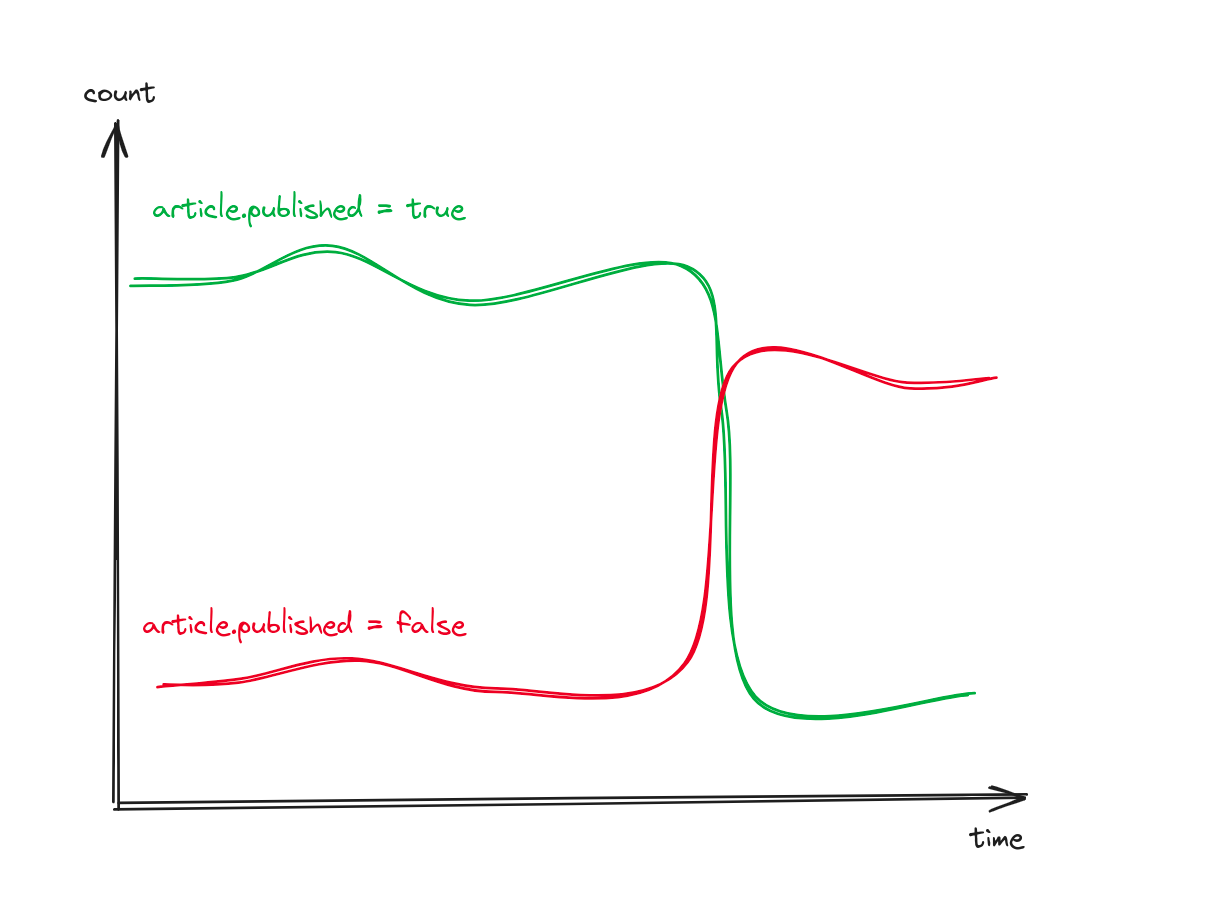
Clearly, the reason users can’t see their articles is because they are posted but they are set to published = false. But why? Let’s see if it’s just a subset of users or if it’s a wide-spread issue.
Number of unpublished articles grouped by user.id
select count()from eventswhere method = "POST"and path = "/articles"and status_code = 201and article.published = falsegroup by user.idorder by count() desc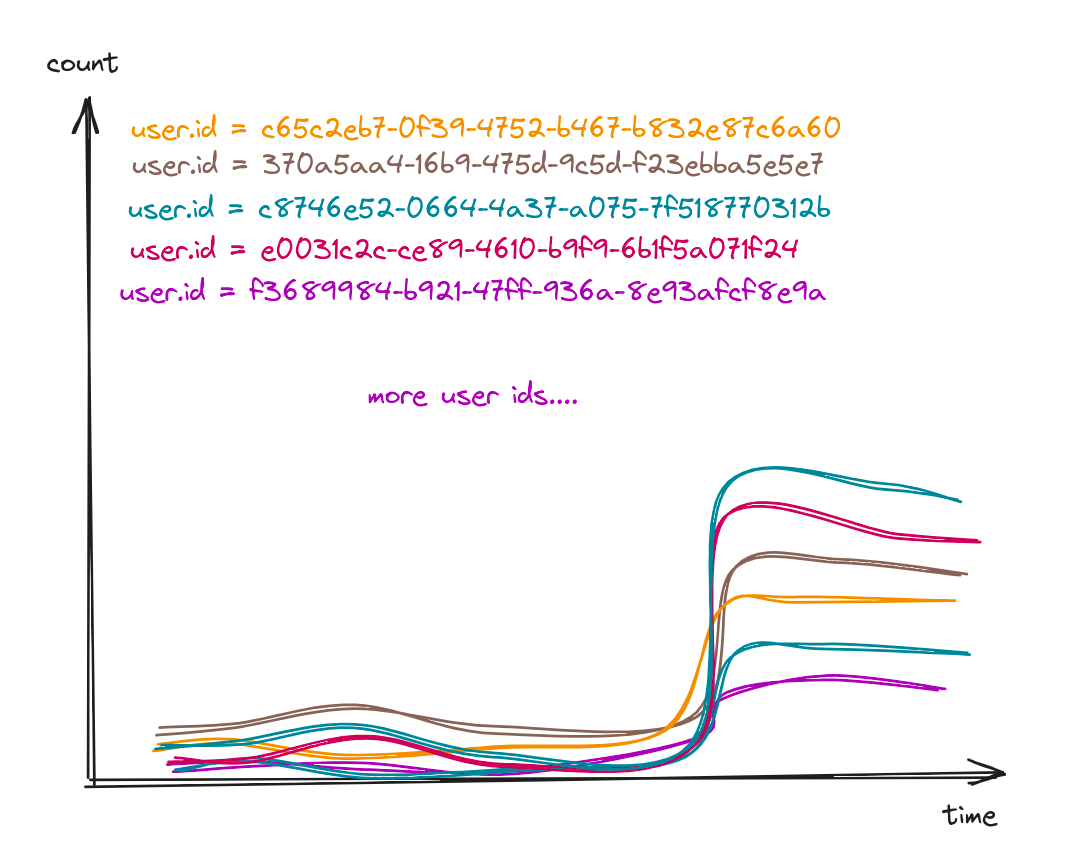
Okay, this is not an isolated issue, multiple users are impacted. But how many exactly? Let’s count all the unique users who posted an article and group them by article.published.
Number of unique users grouped by article.published
select count(unique user.id)from eventswhere method = "POST"and path = "/articles"and status_code = 201group by article.published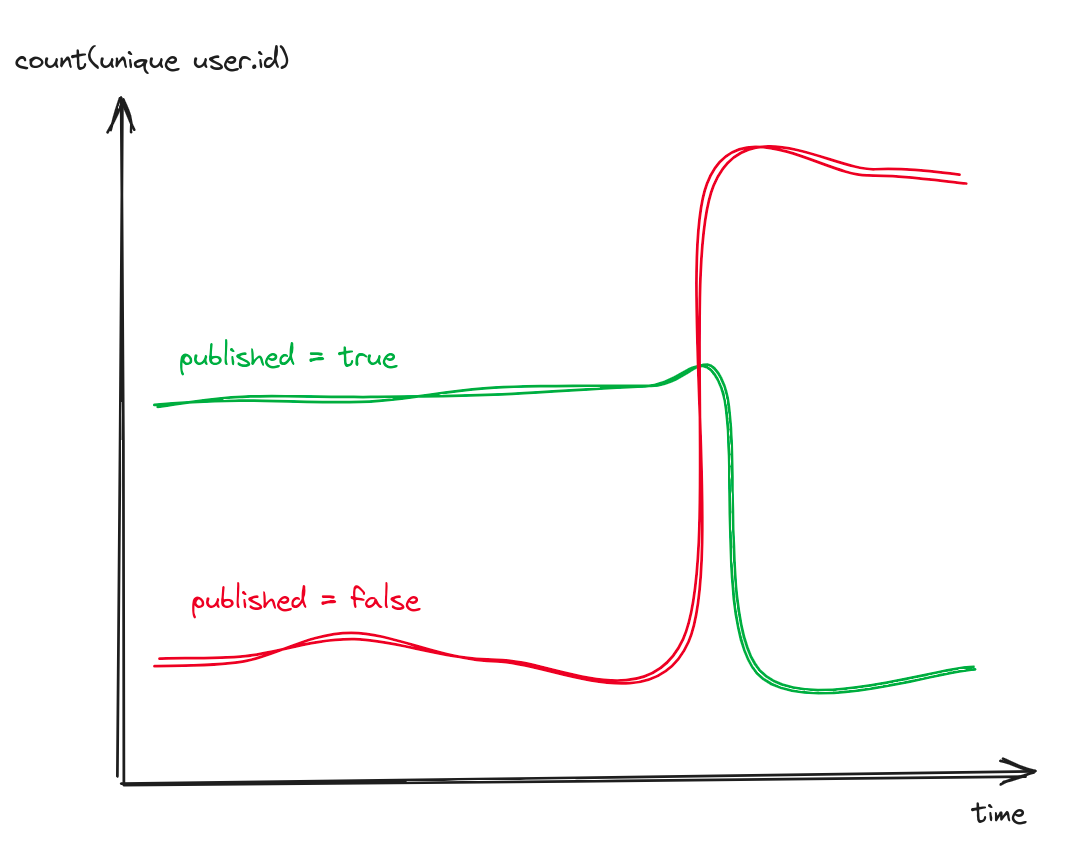
Very few users were posting unpublished articles, and suddenly, most started posting unpublished articles. Clearly this is not a subset of users. But what do these users have in common?
More traditional tooling might get you up to here, if you have diligently implemented structured logs and you have a whole catalog of metrics and dashboards. The next step is usually to go almost randomly look at code, or rely on memory of the day code was written to find the issue.
But you don’t need this with wide events. Your setup will tell you exactly what the issue is, you just have to ask.
Are all these users with unpublished articles on the free trial?
Number of unique users grouped by article.published and user.trial
select count(unique user.id)from eventswhere method = "POST"and path = "/articles"and status_code = 201group by article.published, user.trial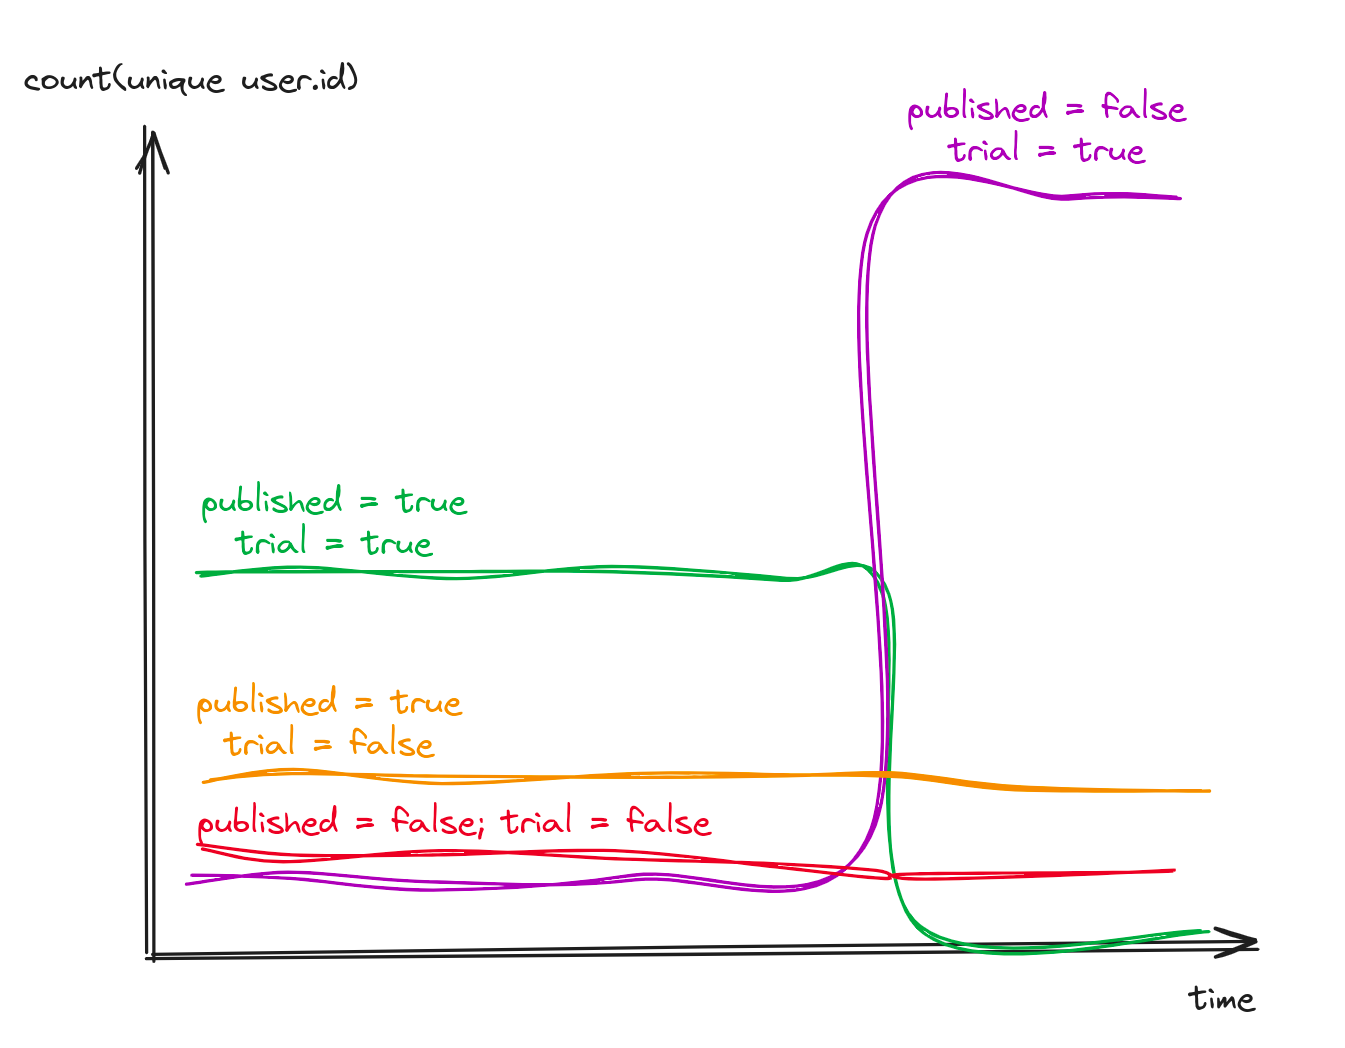
It’s obvious only users on the free trial are impacted. And given they out-number paid users, most articles are posted with article.published = false. It’s clear paid customers are not impacted by the issue.
If additionally, your tooling enables you to write metadata markers such as commits or deployments, you can pinpoint the commit that introduced the defect.
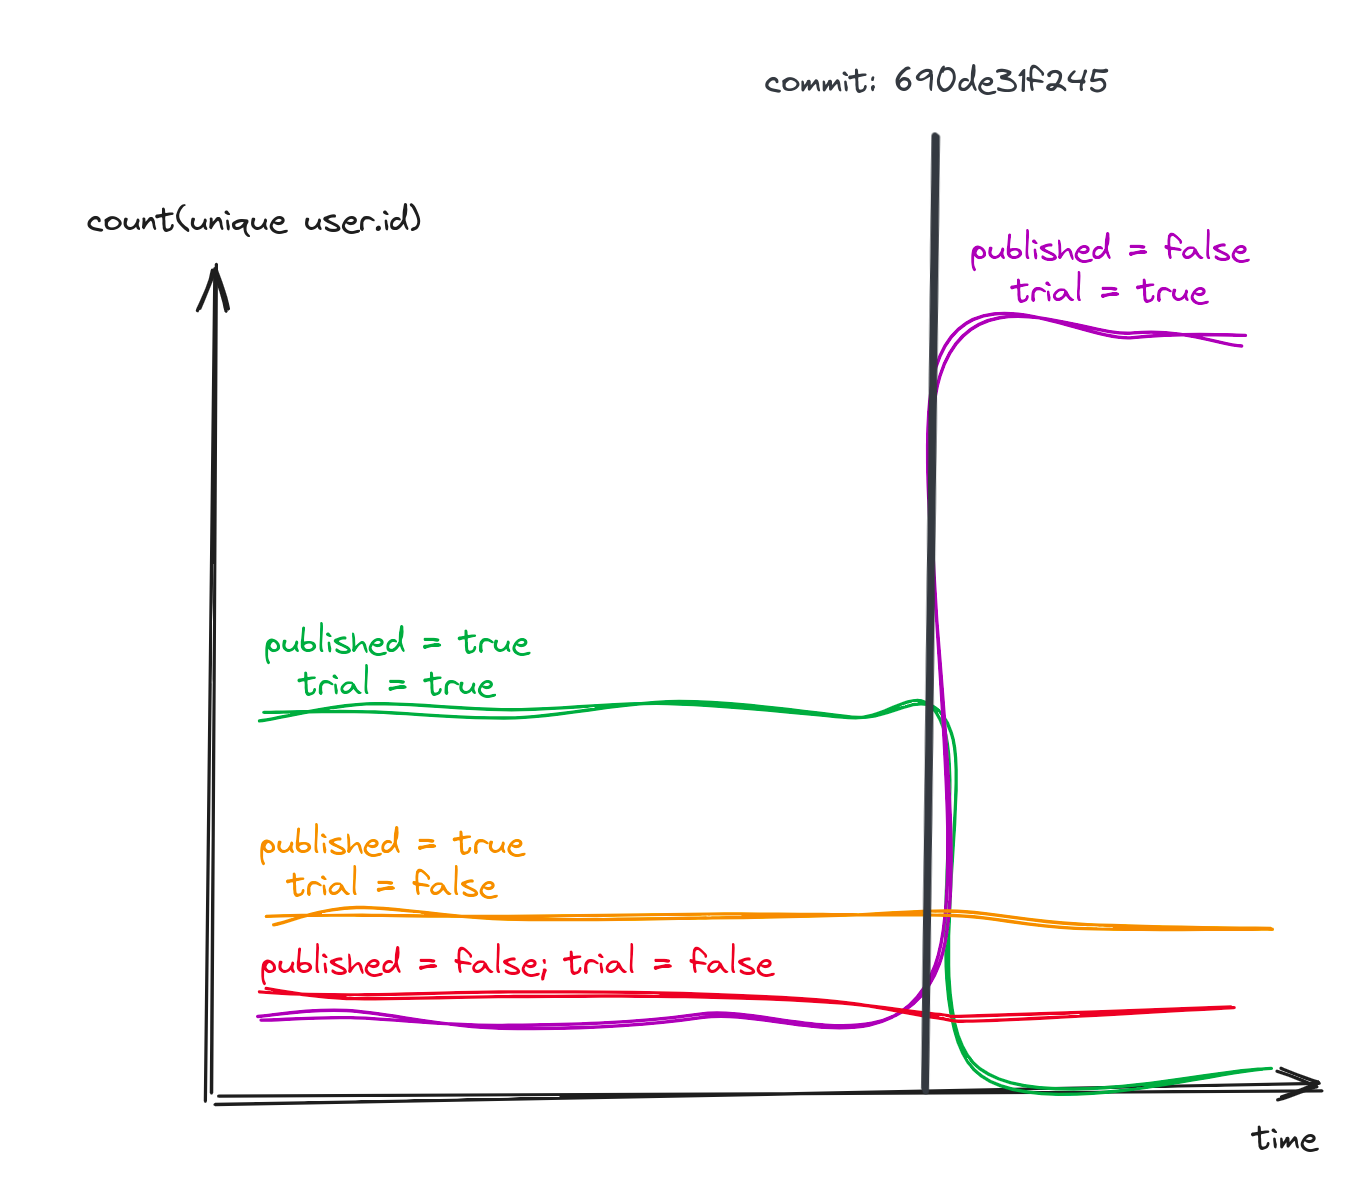
A single click and you’re directly sent to the diff that caused the issue.
How to implement wide-events?
Here’s a very crude implementation of the basic principle of wide events.
app.post('/articles', async (c) => { const startTime = Date.now();
// initialise the wide event const wideEvent: Record<string, unknown> = { method: 'POST', path: '/articles', service: 'articles', requestId: c.get("requestId"), headers: c.req.raw.headers, // optionally add then environment variables // ensure no secrets are stored here env: process.env, };
try { const body = await c.req.json(); const { title, content } = body; const user = database.getUser(c.get("userId"));
wideEvent["user"] = user;
const article = { id: uuidv4(), title, content, ownerId: user.id, published: true, };
const { savedArticle, dbOperation } = await database.saveArticle(article); wideEvent["article"] = savedArticle; wideEvent["db"] = dbOperation;
const cacheResponse = await cache.set(articleId, article); wideEvent["cache"] = cacheResponse;
const response = { message: 'Article created', article }; wideEvent["status_code"] = 201; wideEvent["message"] = 'Article created'; wideEvent["outcome"] = 'ok';
return c.json(response, 201); } catch (error) { wideEvent["outcome"] = 'error'; wideEvent["status_code"] = 500; wideEvent["message"] = error.message; return c.json({ error: 'Internal Error' }, 500); } finally { const duration = Date.now() - startTime; wideEvent["duration"] = duration; wideEvent["timestamp"] = new Date().toISOString();
// flush the wide event logger.info(JSON.stringify(wideEvent)); }});You can build from this, with middlewares, helper functions to add multiple keys simultaneously and also with queues to ensure the wide event is flushed even when the request fails or timesout.
What about OpenTelemetry?
Our crude implementation of wide events above has a major flaw: how do you propagate the requestId we pick up at Line 9 across services and multiple calls. Distributed tracing takes the idea of wide events and builds on top: It enables you to propagate requestId automatically, as well as capturing timestamps and keeping a hierarchy between multiple service calls. It also formalises the language around wide events.
Instead of “wide event”, within the context of distributed tracing, you will say span.
Instead of “request”, you’ll say trace. This is because distributed tracing also works outside the context of request/response applications. For background jobs, long running tasks and event streaming for example.

OpenTelemetry is an attempt to further formalise the instrumentation, collection and exportation of distributed traces. It’s a complex project with a very vast and rich history.
It’s pretty easy today to get confused by Opentelemetry, but if you look at it as a simpler way to generate wide events, you’re winning. You don’t need to understand Opentelemetry Collectors, Baggage, or Resources. Unless you’re building your own OpenTelemetry backend, most of these concepts are mostly relevant to your vendor.
Pick the distro for your language / framework (a language distro is an SDK). Install and configure it to automatically capture all i/o calls, and figure out how to add custom attributes to the span (remember, a span is just a wide event).
In node.js it looks like
app.post('/articles', async (c) => { const currentSpan = trace.getSpan(context.active());
try { const body = await c.req.json(); const { title, content, } = body;
const user = database.getUser(c.get("userId")); currentSpan.setAttributes(user);
const article = { id: uuidv4(), title, content, ownerId: user.id, published: true, };
const savedArticle = await database.saveArticle(article); currentSpan.setAttributes(savedArticle);
const cacheResponse = await cache.set(savedArticle.id, savedArticle); currentSpan.setAttributes(cacheResponse);
const response = { message: 'Article created', article }; return c.json(response, 201); } catch (error) { currentSpan.recordException(error); return c.json({ error: 'Internal Error' }, 500); }});We removed the boilerplate from our code, the business logic is much more legible. OpenTelemetry is responsible for capturing timestamps, environment details, request headers, trace and span IDs, and facilitates sending traces to a vendor, or a self-hosted solution.
Misconceptions
Wide events replace metrics
No, they don’t replace all metrics. Afaik, you cannot replace CPU metrics of your Kafka box with wide events. I’m sure a very determined engineer can replace all metrics with wide events, but is it worth it? For monitoring infrastructure, metrics are your best option. They are insanely cheap and capture what you need to know about your infra.
Where they fail is complex application logic where unknown unknowns are most likely to occur. You definitely should replace all your application metrics with wide events.
Wide events are useful only during outages
No, the beauty of wide events is their context-richness. I have seen product teams use observability data for product analytics, simply because the tooling is more advanced. The issue preventing this from being more widespread is retention periods. Product analytics generally require year+ retention periods whereas observability less.
You must emit a single wide event per service
Earlier I said you should emit a single wide event per service. I lied. There are no rules. Emit as many wide events as you need per request per service. Ideally only one, but there are scenarios where it’s very valid to emit more than one wide event per service. But make sure to emit wide events, not events with 3 fields. And when emitting the new event, ask yourself if you’re not repeating data in both events.
Logs, metrics and traces are the 3 pillars of observability
This is debunked. There are no pillars of observability. Observability is about answering the most uncommon questions about your app. Logs, metrics, traces, wide events, errors, etc. are just data. Data you should be able to query as you wish, asking questions about your app.
You don’t see the 3 pillars of data analytics, why should there be 3 pillars of observability?
Structured logs are wide events
False. Structured logs could be wide events, but not all structured logs are wide events. A structured log with 5 fields is not a wide event. A structured log with no context is not a wide event. If you print the response of a request without the details about the request (headers, path, method, body, etc.), it will be wide, but will it have the context you need to answer unknown unknown questions?
OpenTelemetry is the only modern way to do distributed tracing
No. I recommend distributed tracing, but it has a lot of flaws. It’s grown to try to do too many things for too many people, and that’s a problem. Instrumenting an application shouldn’t be harder than building the application itself.
Some vendors provide their own tracing, sometimes inspired by OpenTelemetry. Some teams have decided to add context propagation and timestamp capture to wide events and that’s their tracing. It’s up to you.
In a nutshell, once you’ve solved an issue with a wide events flow, you’ll never want to go back to greping logs or metrics telling you “there’s a problem”, but no way to drill deeper to know the cause of the problem. With wide-events you stop investigating symptomps so you can focus on finding root causes.
I'm also building polylane, because nobody should be on-call in 2026.